


Google Gemini Outage: Live Updates on the Service Disruption
Users of Google’s Gemini artificial intelligence tool hit a wall on October 8, 2026, when widespread service issues began surfacing across the internet. What started as scattered reports quickly escalated into a significant outage, drawing thousands of complaints to monitoring platforms. The situation has been volatile throughout the day, with report volumes spiking sharply before showing signs of stabilization. This article tracks the timeline of the event, the conflicting signals between user reports and official status pages, and what is currently known about the resolution.
Outage Activity Peaked, Then Showed Signs of Improvement
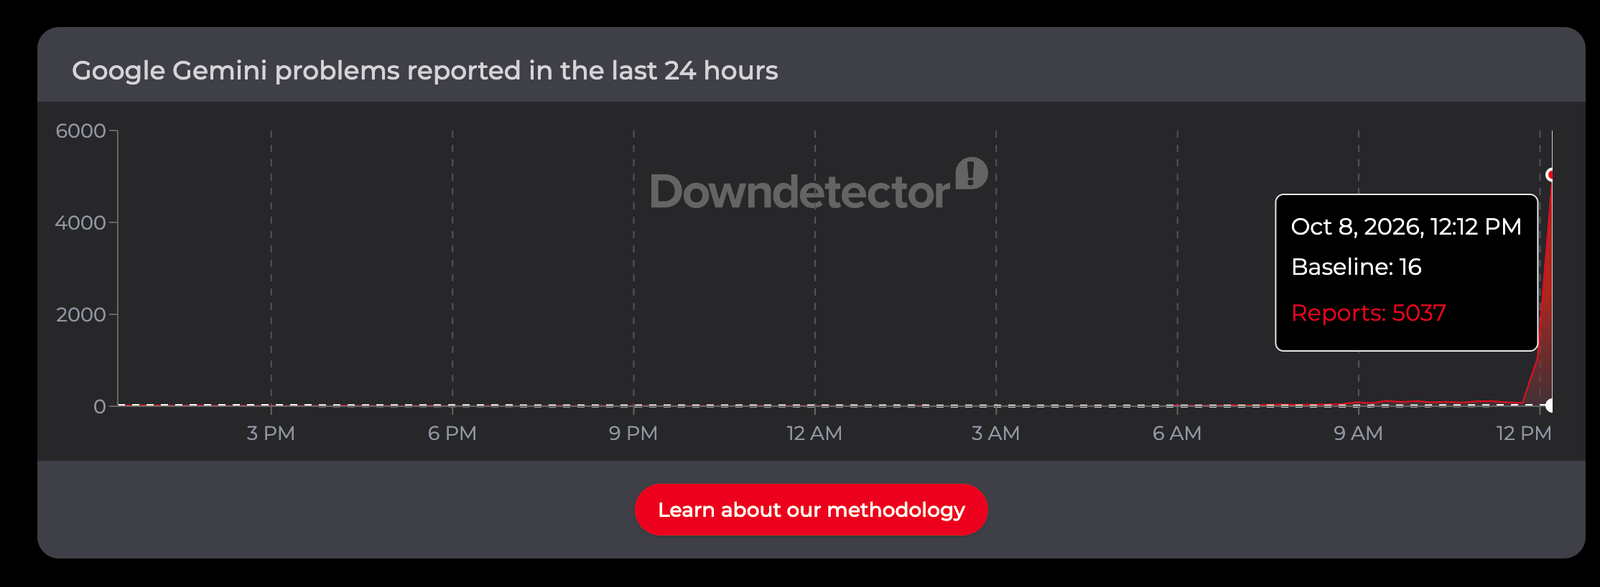
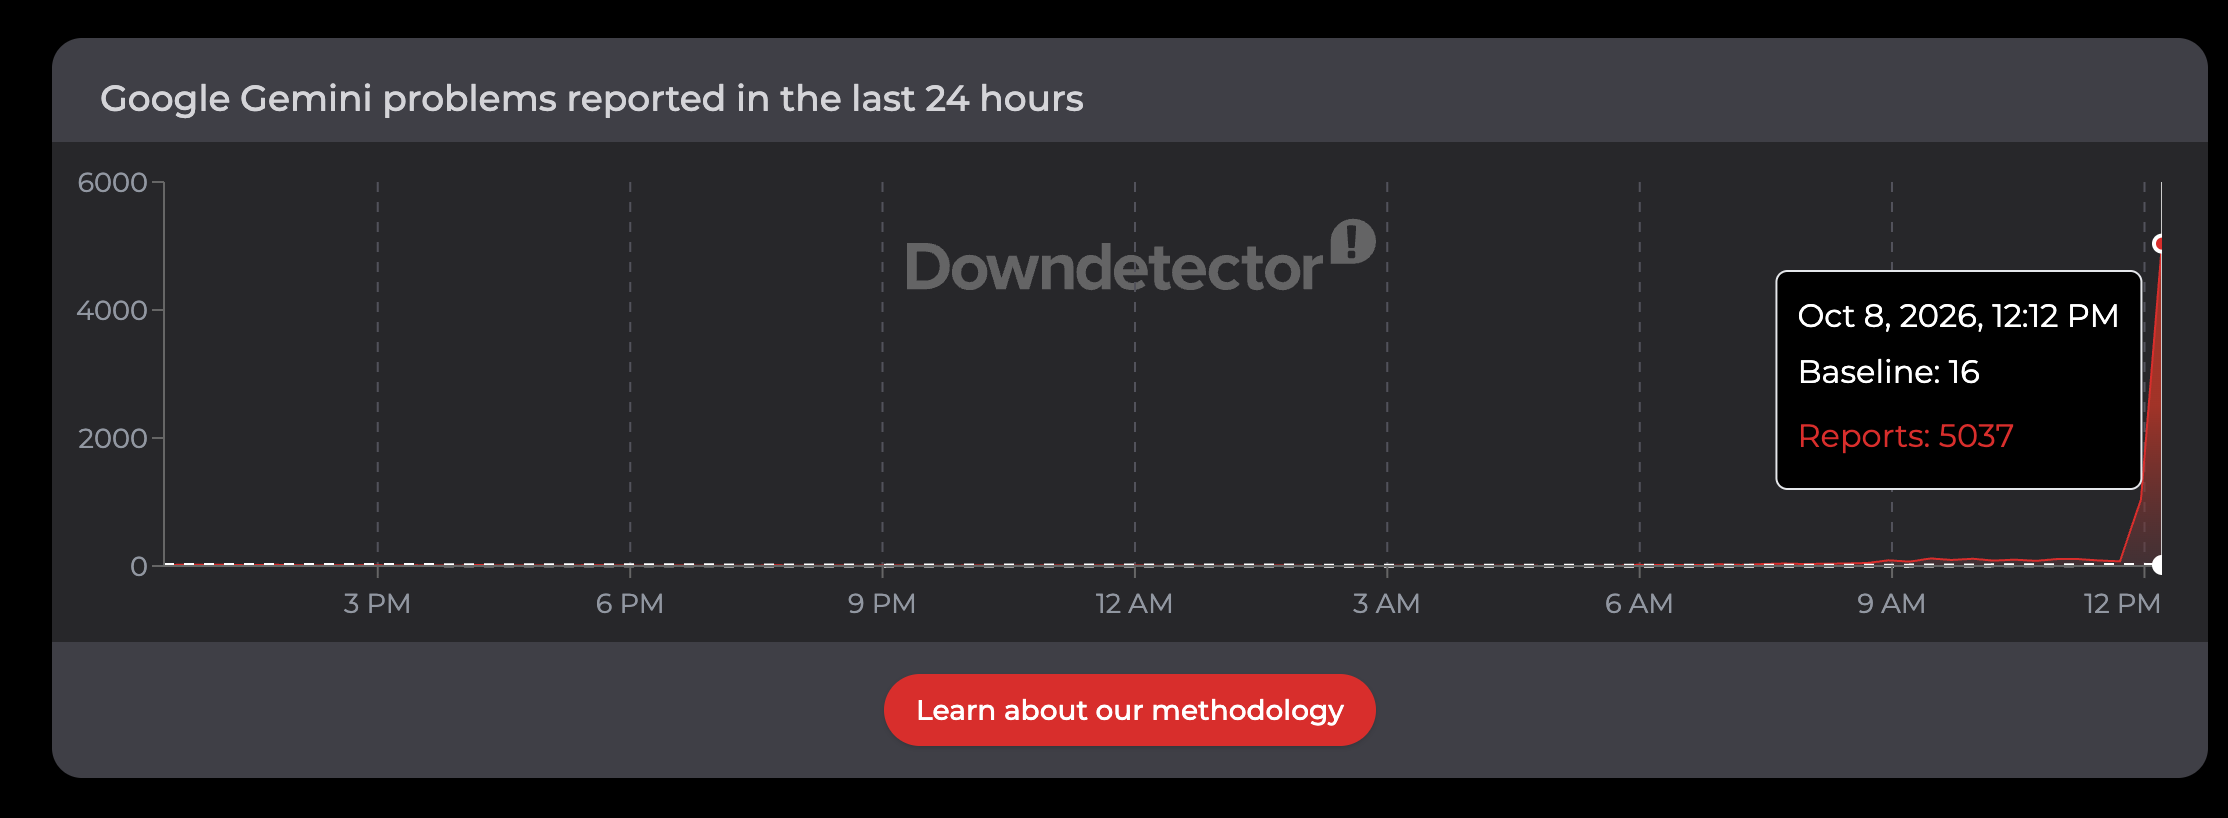
The volume of complaints regarding Gemini followed a dramatic arc over the course of the afternoon. When our live monitoring of the situation began, fewer than 2,000 users were reporting issues. Within just a few minutes, that number climbed past 5,000, indicating a rapid deterioration in service quality that many people noticed simultaneously. Later reports suggested a shift in the trend line.
By mid-afternoon, DownDetector figures indicated a potential downturn. One update noted reports sitting around 4,811, a slight improvement from the peak, followed by further movement suggesting the numbers were nearly halved to approximately 2,000. While DownDetector data can fluctuate as user activity stabilizes, a consistent decline in reported incidents is generally considered the strongest available signal that a large-scale service disruption is resolving.
(Image credit: Downdetector)
Users Report Errors Even as Status Page Says Green
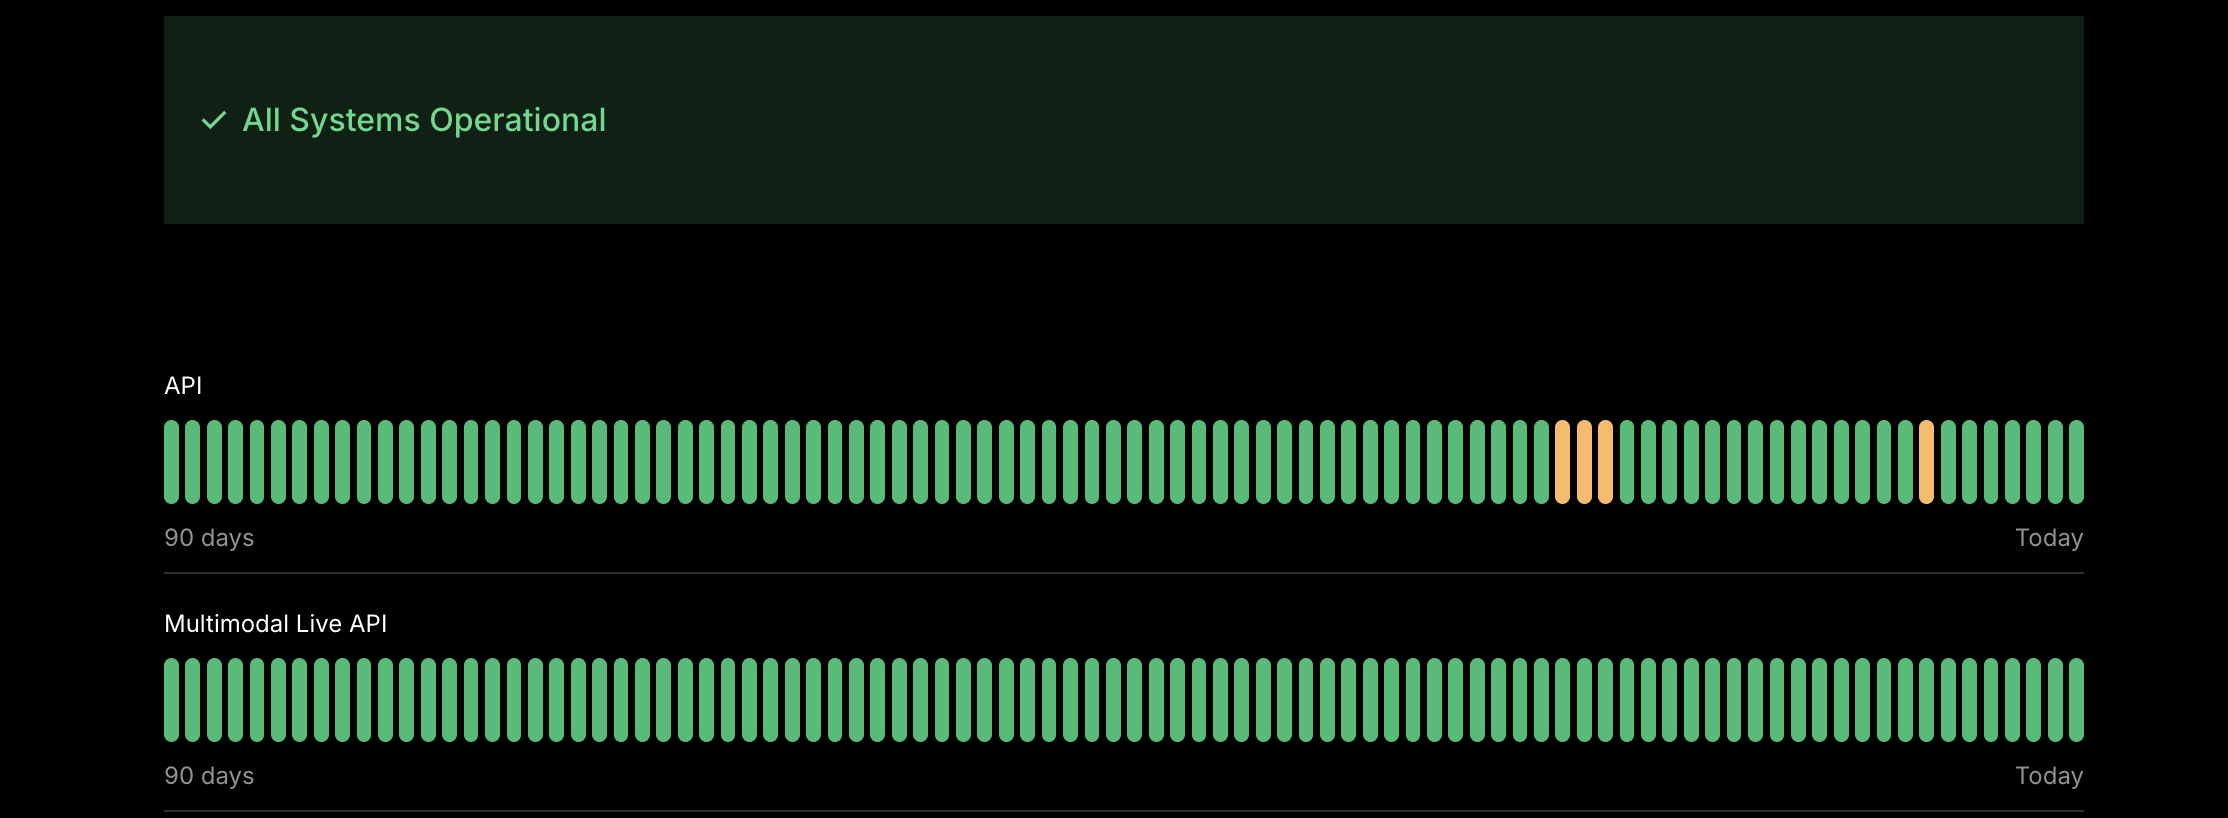
A defining characteristic of this disruption has been the contradiction between user experience and Google’s official communications. While thousands of people reported inability to load Gemini, the company’s official status page continued to display a message stating “All systems operational.” As the number of external reports continued to climb throughout the afternoon, that official stance appeared increasingly at odds with the reality on the ground.
This gap between internal health monitoring and external user access is not uncommon in large-scale cloud services. Automated system checks often probe specific endpoints that may function correctly even when the broader user-facing infrastructure is experiencing latency, handshake failures, or regional routing issues. Notably, Google has not yet issued a formal public acknowledgment of the outage as of the latest checks.
(Image credit: Google)
Understanding Error Code 13 and Other Warnings
As users flooded the comments sections of outage trackers, specific error codes began to emerge. The most prominent was error code 13, which appears when attempting to use Gemini. According to Google’s own help documentation, this code represents “a server-side handshake failure, browser conflict, or account-level desync that blocks text inputs or uploads.”
Separately, a different code, 1155, was reported by users, displaying the generic message “Something went wrong.” These vague messages offer little diagnostic value to the individual, but they are consistent with a server-side fault rather than a problem local to the user’s device. The consensus among support information and community reports is that if you are encountering these specific errors, there is little that can be done on the client side other than waiting for the infrastructure to recover.
Why the Gap Between Reports and Official Updates Matters
The persistence of the “All systems operational” message for hours into the disruption raises questions about how Google monitors its AI services. Third-party aggregators like DownDetector rely on active user feedback, meaning they can sometimes flag issues before the company’s automated systems detect them. In this instance, the discrepancy likely highlights a scenario where internal monitoring thresholds were not breached, or where the outage affected a subset of users that automated probes did not replicate.
This is particularly relevant for AI services like Gemini, which rely heavily on complex backend infrastructure. A “green” status on a dashboard does not always guarantee that every user interaction is succeeding, especially when errors are intermittent or geographically localized.
What Users Should Do While the Service Recovers
Given the nature of the reported errors, patience remains the primary recommendation for affected users. Because the underlying issue appears to be a server-side handshake failure or account desync, restarting a browser or refreshing the page is unlikely to resolve the problem on its own.
If you are experiencing issues, the most reliable approach is to monitor the situation through established outage trackers. Once the report volume on platforms like DownDetector bottoms out and remains low, that is generally the strongest indicator that service has returned to normal. Until Google issues a formal statement confirming the resolution, treat the “All systems operational” message with a degree of caution.
This live report will continue to be updated as new information becomes available from both official channels and user feedback. For now, the trend of declining report volumes is the most positive development seen throughout the day.
Computers, Internet, Electronics, News, Online, Google, Gemini, Artificial Intelligence, Service Outage, Technology